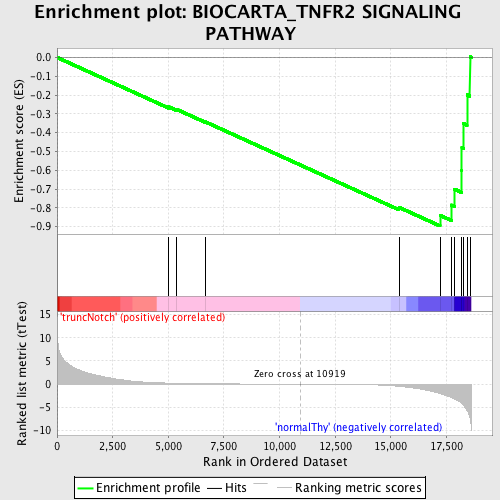
Profile of the Running ES Score & Positions of GeneSet Members on the Rank Ordered List
| Dataset | Set_03_truncNotch_versus_normalThy.phenotype_truncNotch_versus_normalThy.cls #truncNotch_versus_normalThy.phenotype_truncNotch_versus_normalThy.cls #truncNotch_versus_normalThy_repos |
| Phenotype | phenotype_truncNotch_versus_normalThy.cls#truncNotch_versus_normalThy_repos |
| Upregulated in class | normalThy |
| GeneSet | BIOCARTA_TNFR2 SIGNALING PATHWAY |
| Enrichment Score (ES) | -0.8964524 |
| Normalized Enrichment Score (NES) | -1.6131119 |
| Nominal p-value | 0.0022624435 |
| FDR q-value | 0.16323996 |
| FWER p-Value | 0.791 |
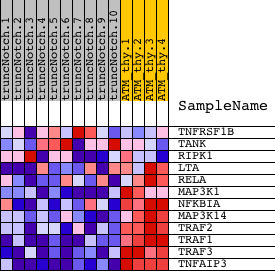
| PROBE | DESCRIPTION (from dataset) | GENE SYMBOL | GENE_TITLE | RANK IN GENE LIST | RANK METRIC SCORE | RUNNING ES | CORE ENRICHMENT | |
|---|---|---|---|---|---|---|---|---|
| 1 | TNFRSF1B | 3990035 5860372 | 5016 | 0.237 | -0.2628 | No | ||
| 2 | TANK | 1090020 2060458 2370400 | 5349 | 0.198 | -0.2750 | No | ||
| 3 | RIPK1 | 3190025 | 6652 | 0.100 | -0.3421 | No | ||
| 4 | LTA | 1740088 | 15367 | -0.457 | -0.7973 | No | ||
| 5 | RELA | 3830075 | 17212 | -1.973 | -0.8399 | Yes | ||
| 6 | MAP3K1 | 5360347 | 17735 | -2.897 | -0.7849 | Yes | ||
| 7 | NFKBIA | 1570152 | 17856 | -3.162 | -0.7007 | Yes | ||
| 8 | MAP3K14 | 5890435 | 18190 | -4.158 | -0.5993 | Yes | ||
| 9 | TRAF2 | 5900148 | 18197 | -4.188 | -0.4796 | Yes | ||
| 10 | TRAF1 | 3440735 | 18269 | -4.576 | -0.3522 | Yes | ||
| 11 | TRAF3 | 5690647 | 18426 | -5.642 | -0.1988 | Yes | ||
| 12 | TNFAIP3 | 2900142 | 18558 | -7.288 | 0.0031 | Yes |